DTrace
The Universal Debugger for Live Production
Why DTrace?
Reduce MTTR (mean time to resolution) for production
- Prevent most production issues going unresolved or taking forever to resolve.
- Debug in live production with negligible overhead to quickly determine root cause
- Unified visibility into both the application and system kernel
Diagnose problems which cannot be replicated in lower environments
- Don’t waste cycles trying to replicate issues in lower environments.
- Resolve problems which only happen under production load
- Login into live data objects to detect state
Prevent issues from making it to production
- Analyze code early to capture potential performance bottlenecks
- Run anywhere locally (in test) or on production cloud for similar analysis
- Multiple language and OS support accelerating time to value
What Capabilities Does it Provide?
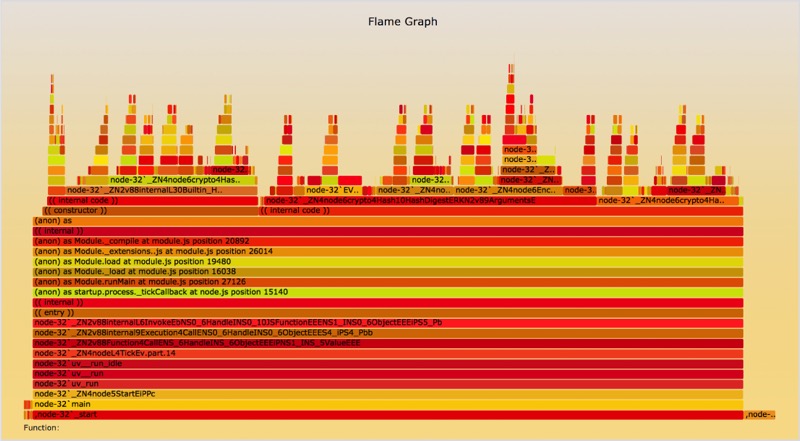
Deep application transaction tracing
Trace application level calls (e.g. java or node.js call stacks), database calls (sql driver calls, sql statements ), messaging calls (redis, memcache, etc) webservice calls and lot more
Keep kernel transaction tracing
Trace Kernel calls from application transactions. Mapped to Application PIDs. Trace system call entry & exit times. Trace executable names and also record data. Massive set of scripts for inspection
Memory leak diagnosis
Diagnose malloc/gc/dealloc at the application/runtime call stack and the kernel call stack level. Capture leaky functions under production load without having to replicate
Production debugging with negligible overhead
Debug for errors, resource bottlenecks, data state corruptions et all Live in Production. Runs scripts in place resulting in negligible overhead.
Core dump analysis
Additional tools like MDB (module debugger) available to conduct core dump analysis when data is stored in Triton Object Storage by running a job and invoking the debugger.
Login into & debug objects
Interactive shell inside a Triton Analytics job can run directly on the stored object to inspect It, rerun the job, & save in-flight files. Debuggers can be invoked from within the job