Visualize IPs on a world map with Triton Converged Analytics
January 24, 2018 - by Seong-Kook Shin
In this post, you'll learn how to create a simple Triton Converged Analytics compute job with Manta to extract users' geographic location, aggregated by city, and feed this data to a simple script to create visualization of IP distribution.
To do that, we will follow these steps:
- We will take a collection of log files with public IP addresses and use Triton Converged Analytics to extract that data. This is the map phase.
- Then, we'll use a customized program to extract the population of each city with their coordinates. This is the reduce phase.
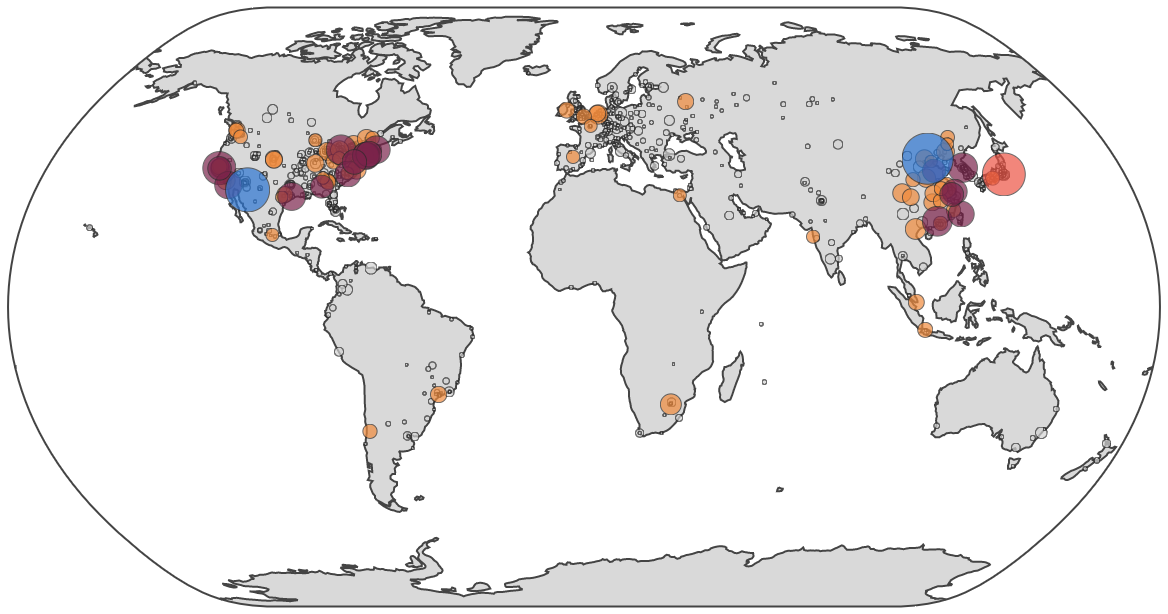
- Finally, we will generate visualization of a world map with the data generated in step 2.
Step 1: use Triton Converged Analytics to extract IP addresses from log files
Let's look at some typical Apache Tomcat access logs. Each access request creates one line with the public IP address:
127.0.0.1 - - [03/Jan/2018:19:57:32 +0900] "GET / HTTP/1.1" 200 11250
127.0.0.1 - - [03/Jan/2018:19:57:32 +0900] "GET /favicon.ico HTTP/1.1" 200 21630
93.22.33.22 - - [03/Jan/2018:19:57:47 +0900] "GET / HTTP/1.1" 200 11250
93.22.33.22 - - [03/Jan/2018:19:57:47 +0900] "GET /tomcat.css HTTP/1.1" 200 5581
121.188.32.156 - - [03/Jan/2018:19:57:47 +0900] "GET / HTTP/1.1" 200 11250
121.188.32.156 - - [03/Jan/2018:19:57:47 +0900] "GET /tomcat.css HTTP/1.1" 200 5581
121.188.32.156 - - [03/Jan/2018:19:57:47 +0900] "GET /tomcat.png HTTP/1.1" 200 5103
[...]
Generate artificial log files and upload them to Triton Object Storage
In a production environment, your web server's access logs are periodically rotated, compressed, then archived somewhere else. Triton Object Storage is an excellent choice for storing your service logs, since you can then run various analytics jobs on those log files. For this demonstration, we are going to generate such logs artificially using following script:
#!/bin/bash
ip() {
    local i1 i2 i3 i4
    i1=$((RANDOM % 255 + 1))
    i2=$((RANDOM % 255))
    i3=$((RANDOM % 255))
    i4=$((RANDOM % 254 + 1))
    echo "${i1}.${i2}.${i3}.${i4}"
}
genlog() {
    local count="$1" prefix="$2" volume="$3" id fname
    [ -z "$count" ] && count=10
    id=$(echo "$volume" | md5sum | awk '{ print $1 }')
    fname="${prefix}-${id}.log.gz"
    echo "generating ${fname}..." 1>&2
    while [ "$count" -gt 0 ]; do
        echo "$(ip) - - [24/Feb/2015:14:06:41 +0530] \"GET /index.html HTTP/1.1\" 200 1401"
        count=$((count - 1))
    done | gzip -c >"$fname"
}
for f in $(seq "$@"); do
    genlog 10000 tomcat-access "$f"
done
Save that script to a file named gen-tomcat-access-log.sh. Give the script executable permissions (chmod +x gen-tomcat-access-log.sh).
Run it with the number of log files you want to generate:
$ ./gen-tomcat-access-log.sh 10
generating tomcat-access-b026324c6904b2a9cb4b88d6d61c81d1.log.gz...
generating tomcat-access-26ab0db90d72e28ad0ba1e22ee510510.log.gz...
[...]
Upload those files to Triton Object Storage:
$ mmkdir -p ~~/stor/tomcat-logs/
$ for f in *.log.gz; do mput -q -f "$f" ~~/stor/tomcat-logs/; done
$ mls ~~/stor/tomcat-logs/
tomcat-access-b026324c6904b2a9cb4b88d6d61c81d1.log.gz
tomcat-access-26ab0db90d72e28ad0ba1e22ee510510.log.gz
[...]
Extract the IP addresses
Let's extract the source IP addresses with a compute job. To verify that the script works properly, we'll use only one log file and get a few lines using head:
$ mfind -t o -l 1 ~~/stor/tomcat-logs/
//stor/tomcat-logs/tomcat-access-166d77ac1b46a1ec38aa35ab7e628ab5.log.gz
$ mfind -t o -l 1 ~~/stor/tomcat-logs/ | mjob create -o "gunzip | awk '{ print \$1 }' | head"
139.27.125.80
147.127.251.53
27.101.122.23
36.201.248.248
171.175.118.218
179.21.244.189
60.249.115.159
68.95.241.130
203.69.111.102
212.169.237.73
$ _
Because it worked as we expected, we could modify the above command slightly to run for all log files like this. If the data we needed was just a list of IP addresses, we could run the following command to achieve it.
Look at the command as an example but do not run it:
$ mfind -t o ~~/stor/tomcat-logs/ | mjob create -o "gunzip | awk '{ print \$1 }'"
This is the map phase in Triton Converged Analytics terminology, to run some command for every input file and stream the output to the next phase (or save them as an object). In our case, the map phase is extracting source IP addresses from the access log files.
Step 2: extract the population of each city with their coordinates
To visualize this data, we need to aggregate each IP address based on geolocation and create records for each city. We will create a stream that provides a list of these IP addresses and feed it to a program to find the geolocation of each IP address, aggregating all IP addresses belonging to a city, and generate records with the city name, location, and population. We will do this in the reduce phase of our job, generating new data from the output of the map phase.
Create a CSV file with the data
Ideally, we want to create a CSV output with the following fields: name (city name), pop (population of IP addresses), lat (the latitude of the city), lon (the longitude of the city), and group (cluster id of the group based on the population) like this:
name, pop, lat, lon, group
"US:San Francisco", 7299, 37.7749, -122.4194, 1000, 0
"KR: Seoul", 1078, 37.5111, 126.9743, 2
[...]
Fortunately, I have written a small program, goip to do such a task. It will:
- Download the geolocation database from MaxMind
- Read IP addresses from a standard input
- Write the city records in CSV to standard output
Once you've setup a Go build environment, it's trivial to build goip:
$ go get github.com/cinsk/goip
Note, that Triton Converged Analytics compute jobs run in a Triton SmartOS instance. To cross-compile goip, you'll need to set up the GOARCH and GOOS environment variables properly.
$ GOOS=solaris GOARCH=amd64 go build github.com/cinsk/goip
Upload the binary, goip, to someplace in your Triton Object Storage.
$ mput -f goip ~~/stor/
$ mls ~~/stor/goip
-rwxr-xr-x 1        6095525 Jan 03 11:06 goip
To specify the map phase and the reduce phase, you can use one of the following commands:
$ mjob create -m  -r
$ mjob create  ^^
Also, remember that our reduce phase uses our own program, goip. To make this program available to the compute job, you'll need to specify it as an asset using -s in mjob command.
NOTE: Using the -o flag with mjob create will wait for the job to complete and then fetch the outputs for you.
$ mjob create -m -s ~~/stor/goip -r
Finally, execute this command to create the map-reduce job:
$ mfind ~~/stor/tomcat-logs -t o | \
    mjob create \
        -m "gunzip | awk '{ print \$1 }'" \
        -s ~~/stor/goip -r /assets//stor/goip
added 10 inputs to 1423349f-975e-e4ca-cb49-dbbf1c15d5c3
The above command will not wait for the job to be done to print the job ID. You can use mjob watch to wait for job to finish.
Once the job is completed, the file ~~/jobs/ will be created and its content will be the full pathname of the output of the reduce phase. You can also execute mjob outputs for those results.
$ mget ~~/jobs/1423349f-975e-e4ca-cb49-dbbf1c15d5c3/out.txt
/$MANTA_USER/jobs/1423349f-975e-e4ca-cb49-dbbf1c15d5c3/stor/reduce.1.0b0704e4-0b14-43c4-80d7-c24e495f20c6
$ mget ~~/jobs//out.txt | xargs -n1 mget >> pop.csv
$ head pop.csv
name,pop,lat,lon,group
"CN: Beijing",3272,39.9289,116.3883,4
"US: Fort Huachuca",2424,31.5273,-110.3607,3
"JP: Tokyo",2293,35.685,139.7514,3
"US: Palo Alto",1363,37.3762,-122.1826,2
"US: Dearborn",1104,42.3223,-83.1763,2
"CN: Guangzhou",1101,23.1167,113.25,2
"KR: Seoul",1078,37.5111,126.9743,2
"US: Houston",969,29.7702,-95.3628,2
"US: Cambridge",945,42.3646,-71.1028,2
Step 3: generate the world map data visualization
Once you have downloaded the CSV file, feed it to ip-world-map-d3.py (which requires Python 2.x). This script is already in your $GOPATH/src/github.com/cinsk/goip/examples/:
$ $GOPATH/src/github.com/cinsk/goip/examples/ip-world-map-d3.py pop.csv
View my working world map example.
Wrapping up
This demo was a realistic but simple example of using Triton Converged Analytics with an interactive output.
Special thanks to MaxMind for generously providing a free IP gelocation database. Also thanks to plotly for providing such a rich Python library for generating the world map.