Containers and microservices and Node.js! Oh, my!
January 12, 2017 - by Wyatt Preul
Learn how to build and scale microservices with Node.js and containers using ContainerPilot on Triton. This project will give you a working IoT dashboard connected to a SmartThings IoT hub and devices. You can use it to monitor IoT devices, but it's really designed as an example of how to build containerized microservices applications in Node.js.
This is a new version of our earlier example of how to build Node.js-based microservices that implement the Autopilot Pattern that replaces the contrived customers and sales apps with real, working IoT apps.
Source and structure
The example project is freely available on GitHub. Each of the folders in the repository contains a different microservice that add to the overall project. Each microservice folder has a Dockerfile that describes how to assemble the image that will be used for development and carried into production.
Below is an architectural diagram depicting the composition of microservices that make up the project. When everything is working, a frontend web application is accessible that will display a set of graphs using sensor data. There are three sensors, each using the same Docker image with a different configuration, pulling data from a SmartThings service. By default, the SmartThings service is producing random data. However, it can be exposed and used with an actual SmartThings hub if one is available. The hub requires a custom Smart Application to be running that will send sensor data to our SmartThings service. Each of the sensor containers pushes data to the serializer microservice, where the data persists in an InfluxDB database named sensors. The frontend is connected to the web server using WebSockets; this allows a near real-time experience where new sensor data is pushed to the browser client as soon as it's available to the frontend.
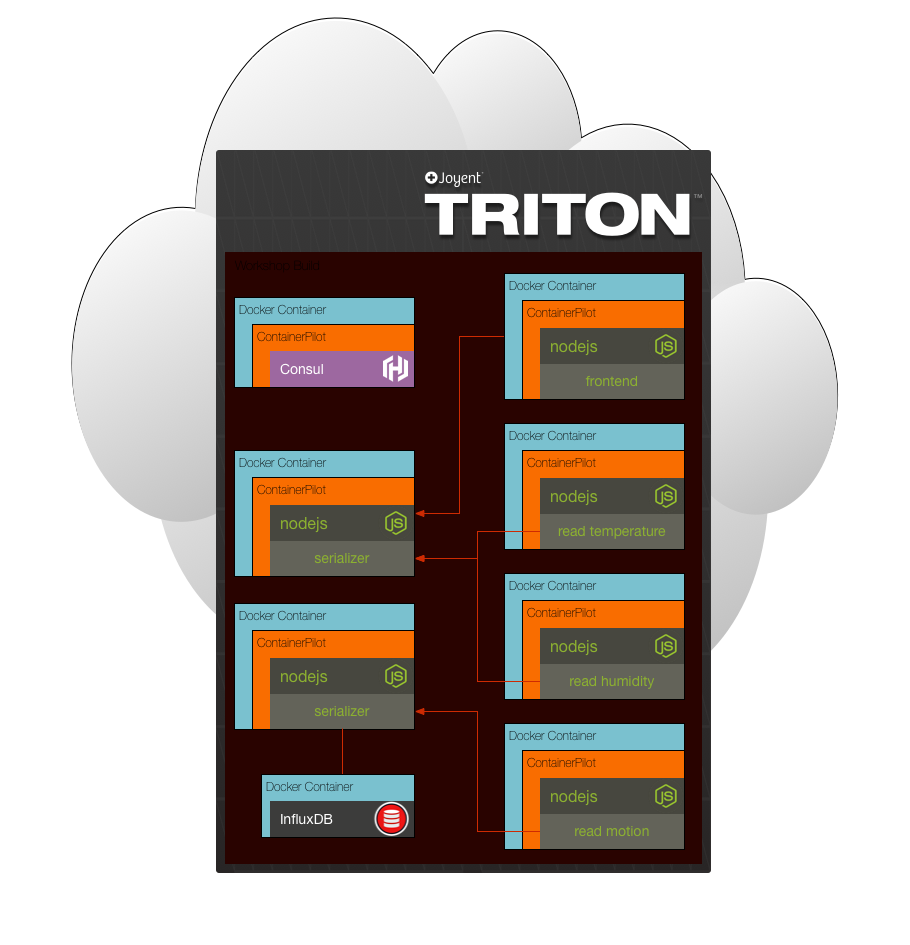
There are zero differences between the Docker images running in development and production. Instead, the only differences that exist are with the environment variables between the various environments that are deployed to. The production environment variables are generated by running the setup.sh script in the root of the project. The resulting environment variables describe where the service discovery catalog is located, depending on the data center you are deploying to. This is an important benefit of choosing Docker, as immutable images help to ensure consistency across your deployments.
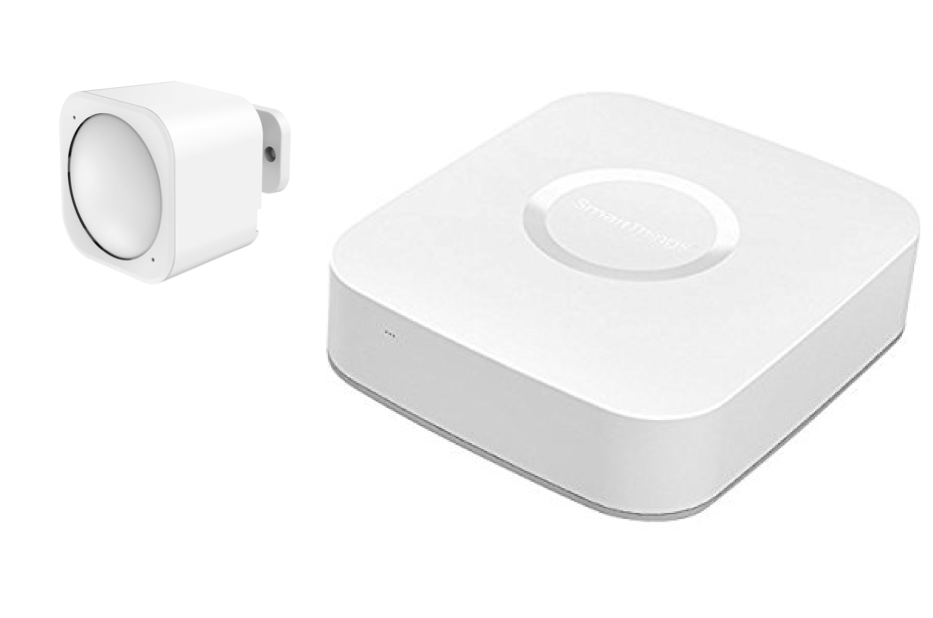
On the IoT side of the project there is a multisensor that is connected to a SmartThings hub using the z-wave protocol. There is a custom SmartApp running on the SmartThings hub that pushes sensor data to our SmartThings service. The custom groovy code for the SmartApp is available in the SmartThings directory. The SmartThings hub and the multisensor are used to send the service real-life sensor measurements, otherwise you can use the default implementation which provides random sensor data. Below is an image of the multisensor and SmartThings hub that we are using in this example.
Node.js modules
Several modules are used to deliver the final project. All of them are necessary, but the following list highlights a few that are especially useful and worthwhile to investigate beyond this post.
- hapi - web API framework
- Seneca - microservices framework
- Piloted - ContainerPilot integration, relies on consul
- Wreck - simple module for making performant HTTP requests
Dockerfile
Each of the microservices in the project is built using Node.js. To keep the image file size small, each Dockerfile is using the official Node.js Alpine base image. It's recommended to pin to a particular version of the base image so that your image doesn't break with newer published versions of the base image.
The next Docker image build step installs curl, which is covered in the health checks section below. After curl is installed, both Consul and ContainerPilot are installed. With ContainerPilot you will need to set an environment variable that either is the configuration or points to a file that contains the configuration to use. A ContainerPilot configuration describes what services exist in the container, what service discovery catalog to use, and any backends that the container needs to know about. There are additional configuration options, but these are the primary options that our example project is concerned with.
The only remaining steps in the Dockerfile are to copy your source code to the image, install any local dependencies, and start the process. ContainerPilot behaves as an init process should, and therefore is the entry point or command that you should specify in the image. For example, to start a Node.js process located in the image at /opt/app/index.js you can set the Dockerfile CMD to the following.
CMD ["containerpilot", "node", "/opt/app/"]ContainerPilot will handle waiting for child processes and reap any zombie processes. It will also restart your application if the application process happens to die. This is important, the main process inside of a Docker container needs to behave like an init process since it's running as PID 1.
Health checks
Each microservice also relies on a local HTTP request for health checks. Therefore, the first thing installed in the image is curl. A significant benefit to local only health checks is that each microservice doesn't need to listen for external HTTP requests to hit a health check endpoint. In fact, none of the sensor microservices expose any ports outside of the container. This means that these sensor data tasks that ingest data into the serializer are not vulnerable to health check denial of service attacks. Instead, ContainerPilot reports a heartbeat to consul to notify it that the local service is healthy.
The health check for each of the services is straightforward. Curl is executed against a health check endpoint that should return a status code in the 200 range. If the request fails or the status code indicates a failure, then curl will exit with a non-zero exit code, which ContainerPilot interprets to mean that the service is unhealthy. When a process for a service has a non-zero exit code, ContainerPilot will not send a heartbeat to consul. At a certain point, when a service continuously fails to send heartbeats to consul, it will be marked as unhealthy and will be omitted from responses for a list of healthy services.
One of the benefits of making these ingestion tasks into a long running process is that you can have built-in health checks, which are reported to consul. This allows you to monitor the health of each of each ingestion process inside of the consul dashboard. If having long running tasks isn't desirable, there is also a ContainerPilot option to specify periodic tasks. Additionally, if you prefer to have long-running tasks without health checks, you can use the coprocess option.
Service discovery
Each of the microservices in our example project depends on a service discovery catalog to find the address and port for each other. This is also the case for the database, which is written to from the serializer microservice. Once the serializer starts, it makes a request to consul to discover the address and port of any healthy InfluxDB instances that exist. If none are found that are healthy, then the serializer will not try to make any database connections. This allows for the InfluxDB to startup or to come down at any time, without breaking the serializer. If the serializer starts to receive data that it's responsible for saving and the database doesn't exist, then the serializer will buffer the data locally until an InfluxDB instance is available. Once the database comes online, then any locally buffered data is flushed to it. If you choose to adopt a similar approach to responding to database failure, you should consider adding memory limits for how much data to save locally. This approach will not work for all scenarios, but in the case of IoT data, the best effort to retain basic sensor data should be more than sufficient.
There are definite trade-offs with adopting a centralized service catalog instead of a set of well-defined hostnames and load balancers. One major trade-off is that the client application is now responsible for balancing requests to services. Alternatively, if there were a load balancer, then it would manage this duty. However, the advantage is that now the application is aware, ahead of time, if a service it depends on is healthy or not, and can avoid making requests that will fail.
To help with the balancing of requests, we created a Node.js module named Piloted that will round-robin each request to the next available service provider. This module will also maintain the list of healthy services and reload them when their state changes in consul. The reloading of the service information is a result of configuring ContainerPilot to send a hang up signal to our process when a backend service changes in consul. This also means that our application doesn't need to monitor the consul catalog for changes as that will be done for us.
All of these design decisions results in a set of microservices that may depend on each other but can be deployed and started in any order. If a backend service is unavailable, then the dependent service won't try to connect. Similarly, once a backend service is available, any dependent services are notified and can act accordingly.
Another, sometimes hidden, benefit of this design has to do with moving a project through different deployment environments. Typically, with a load balancer, the environment variables or configuration passed into a service indicate where the various environment-specific hosts are. The more backend services that an application depends on means that there are just as many configuration options that need to be changed when going from development to production. However, when using a service discovery catalog, deploying to a new environment only requires changing the configuration to point to the new catalog server. The implications of this are that misconfigurations are less likely to occur.
Running locally
Now that you have a basic understanding of the Autopilot Pattern approach and the various microservices that comprise our project let us run it locally. First, you will need Docker installed and a local Docker host to deploy to. Next, clone the git repository locally and change directories into it. Finally, execute docker-compose -f local-compose.yml up -d to build and run the project locally.
To check that all of the containers are running you can execute the ps command by running docker-compose ps. This will display all of the containers that are running as well as the ports that they expose. You can also inspect an individual container to see if the status is set to running. For example, to check if the consul container has a "running" status run the following command: docker inspect nodejsexample_consul_1 | json [0].State.Status. The previous command requires the json module to be installed and assumes that the name of the consul container is "nodejsexample_consul_1".
After everything starts, you will be able to navigate to http://localhost:8500 in a web browser, assuming your Docker host is available on localhost. This is the location of the consul dashboard. Once open, the dashboard displays all of the services that are registered and their health status, below is an example of what the dashboard looks like after the initial startup.
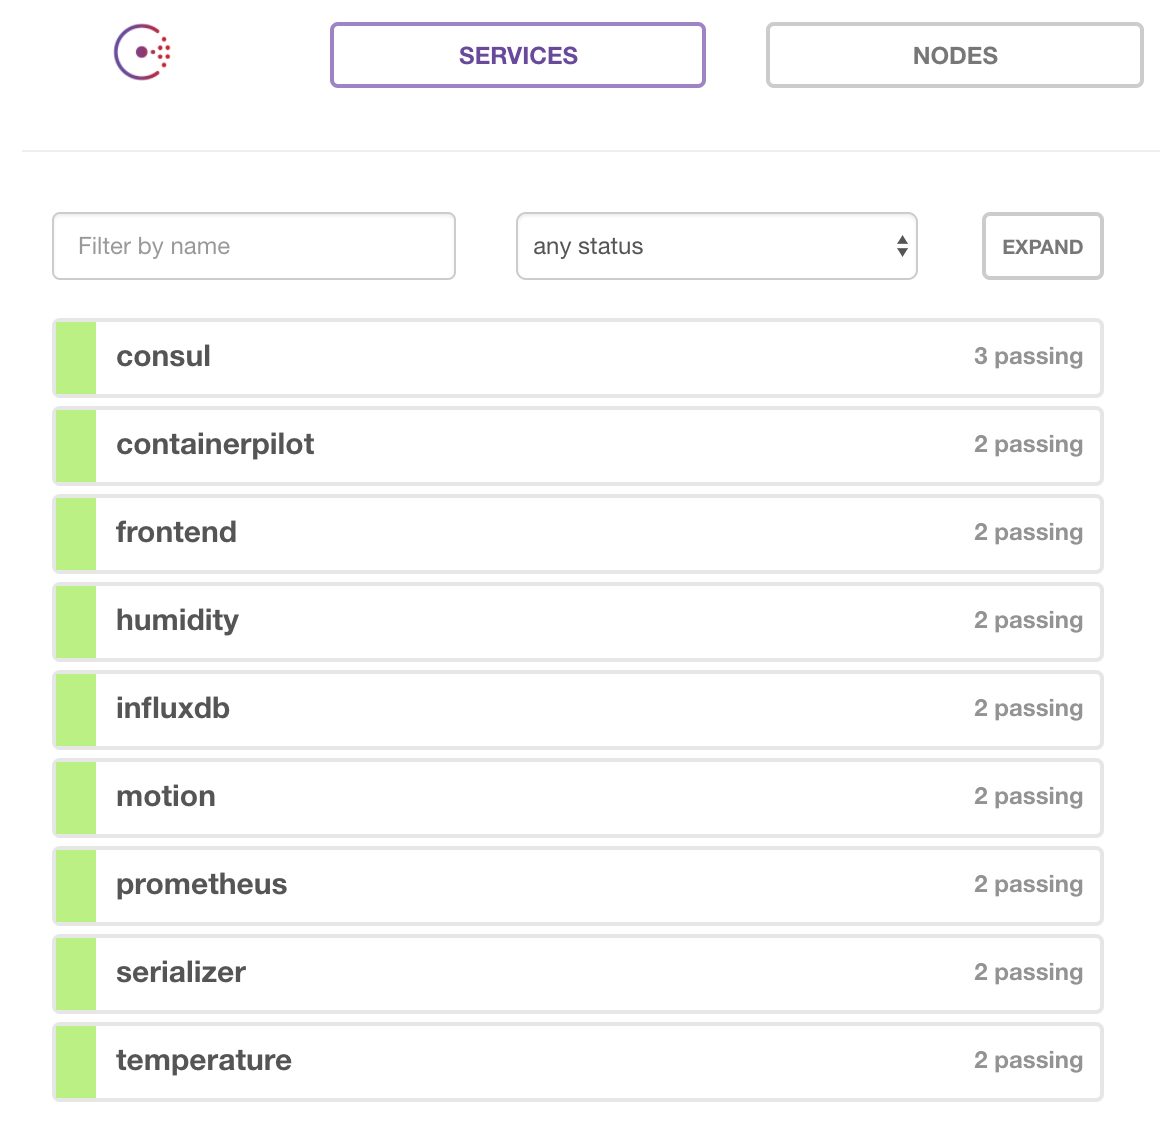
The health of each service is visible in the consul dashboard. Additionally, each doesn't need to be configured with the address of its dependencies. Instead, it will use the consul API to discover the addresses of any healthy services it cares about. Furthermore, if the health of a service changes or new instances are added to the catalog, then ContainerPilot will notify the dependent service. To demonstrate this point, use the scale command on docker-compose to add more serializer instances.
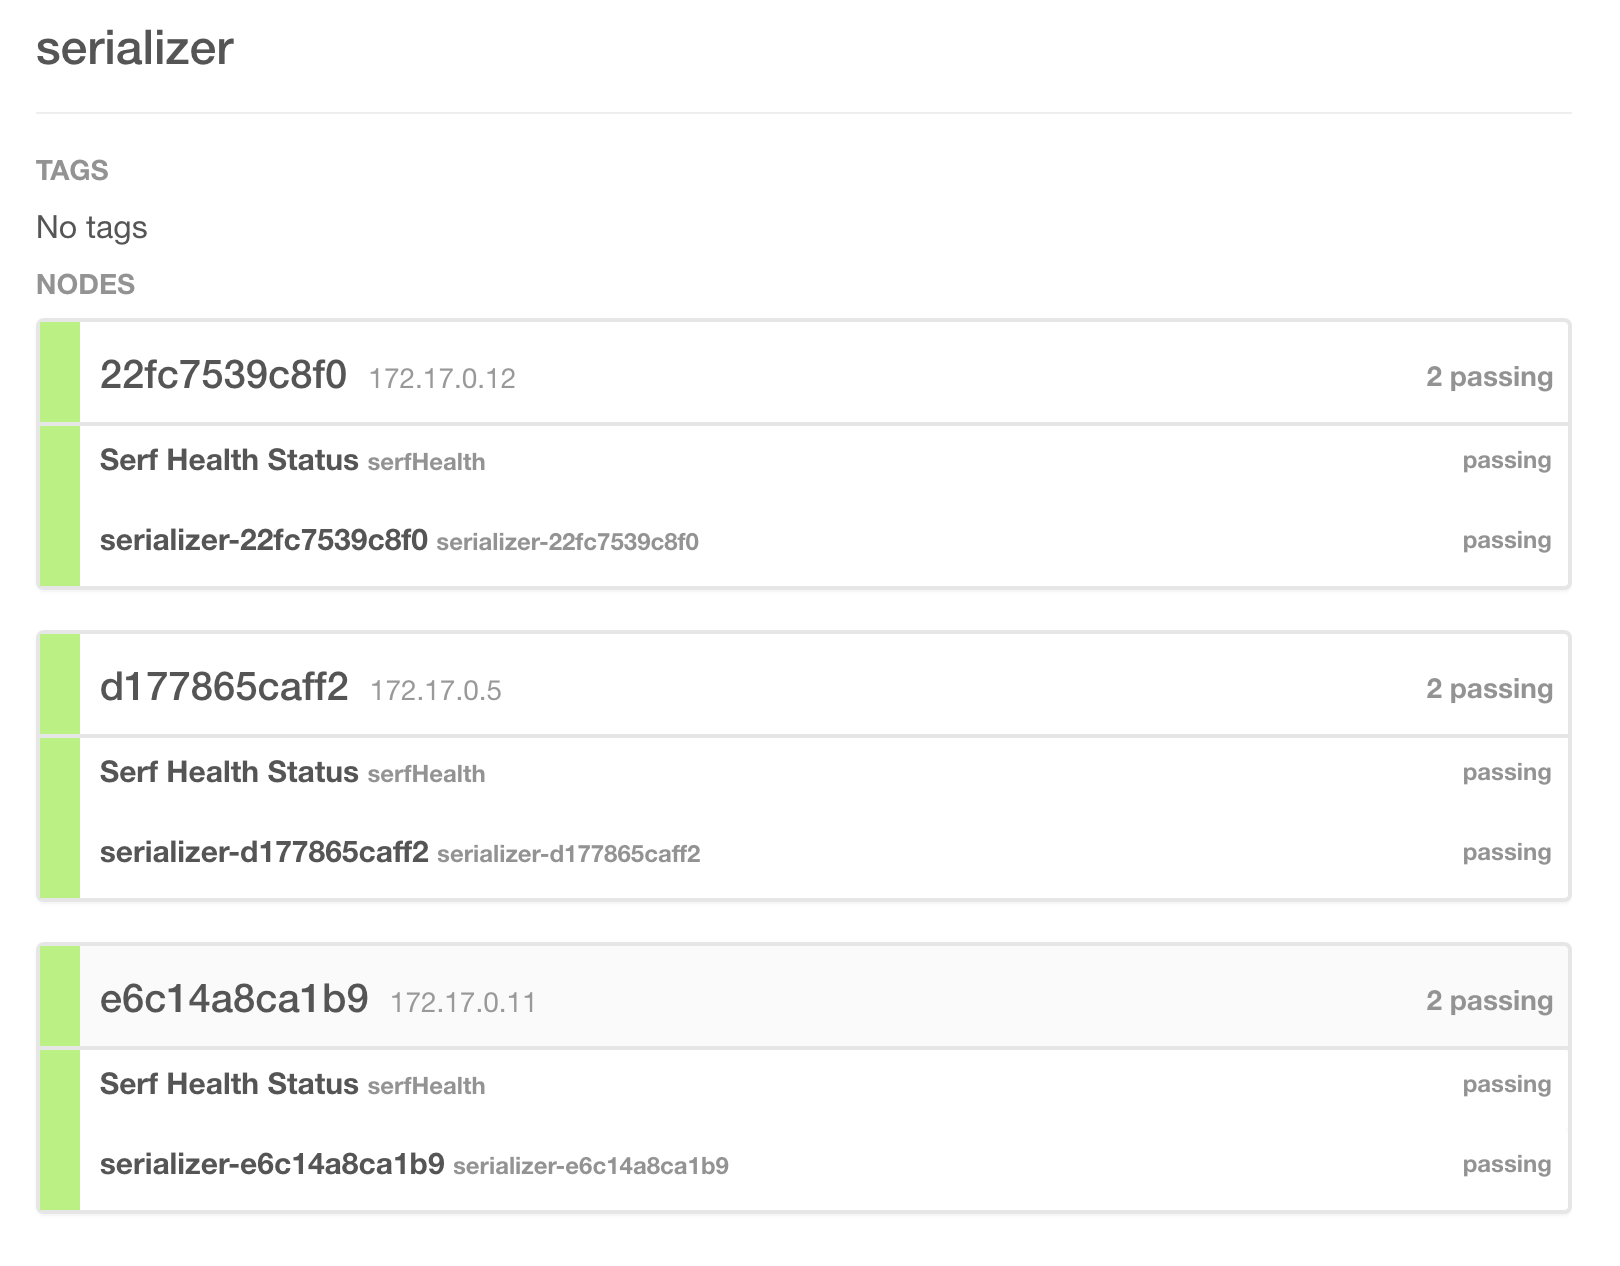
docker-compose -f local-compose.yml scale serializer=3When you refresh the consul dashboard and select the serializer service, you will now see three nodes registered in the catalog. Below is a screenshot of the new instances that were auto-registered in consul with ContainerPilot.
Open the browser and navigate to http://localhost:10001 to view the frontend. Over time this will display three line graphs with the data reported from the three sensors. Below is a screenshot of the humidity graph after a few seconds of reporting data.
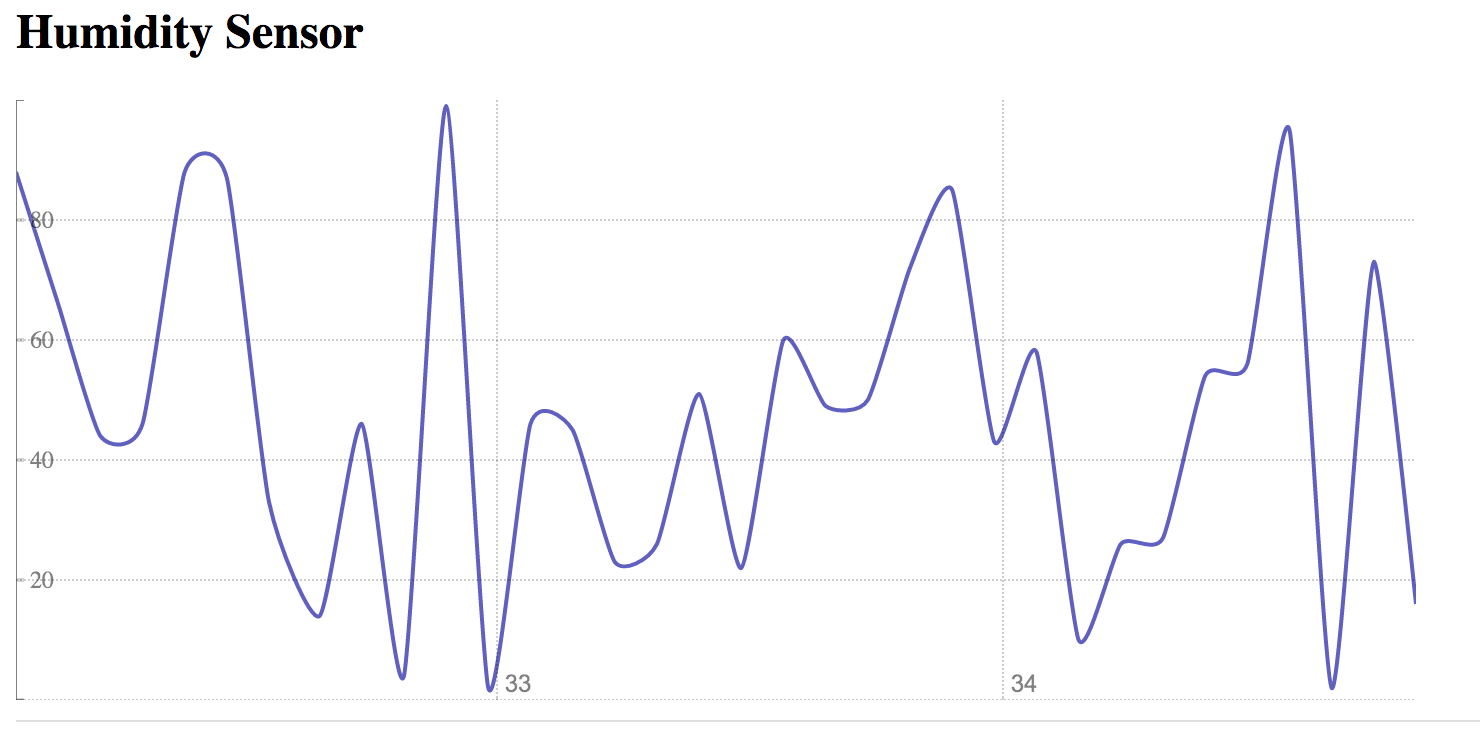
One of the powerful features of microservices implemented with the help of ContainerPilot is that dependent services are immediately notified whenever a dependency is unhealthy. As a result, there are fewer requests that should be made that will fail compared to microservices that aren't aware of the health of dependencies. This approach aligns well with microservice design, which ought to be able to cope with failures and not be too tightly coupled with other services. To demonstrate this behavior, stop the humidity sensor service by running the following command while keeping the browser window open to the frontend sensor graphs. The temperature and motion graphs will continue to report new data while the humidity graph will stop. When you open the consul dashboard, you will see the humidity sensor service go to an unhealthy state and eventually will be removed entirely from the catalog.
docker-compose -f local-compose.yml scale humidity=0Deploying to production
Another powerful characteristic of the Autopilot Pattern is that the deployment of projects is the same across environments. To demonstrate this truth, let us deploy the same example project to Triton. If you don't already have an account, please sign-up for a free trial and setup an ssh key on your account to use for this exercise. You can now manually set the DOCKER_HOST environment variable to point to a Triton data center, or simply run the following command eval $(triton env). With Triton, the data center is one giant Docker host; this is why the DOCKER_HOST only needs to point to the data center host. Furthermore, with Triton, the Docker containers are running on bare metal hardware in the data center, not in a virtual machine. Run the ./setup.sh script to setup a file to use for environment variables to use with your account. Finally, run the same docker-compose command to deploy and run the project containers to Triton, which is shown below.
docker-compose up -dTo launch the frontend run the following command.
open http://$(triton ip nodejsexample_frontend_1)Similarly, to launch the consul dashboard you can open the browser to point to the address of the consul instance. Do this by running the triton ip, only this time use the name of a consul container. Once open, the consul dashboard should look the same as the one you had running locally. The consistency that exists between the production and development environments help to make debugging production issues simpler.
